Track
Campaign Structure
UTM naming, source and medium clarity, campaign taxonomy, GA4 event thinking, and cleaner links between channels and reporting.
Measurement & Campaign Reporting
I build practical measurement workflows across GA4, UTMs, email analytics, newsletter reporting, dashboards, HubSpot, Salesforce, and campaign performance operations.
A practical view of the measurement systems I am developing through certifications, public gallery reporting, and volunteer-ready campaign builds.
Track
UTM naming, source and medium clarity, campaign taxonomy, GA4 event thinking, and cleaner links between channels and reporting.
Report
Email analytics, newsletter reporting, dashboard views, and simple summaries that make campaign activity easier to understand.
Improve
Looking for patterns in performance so teams can see what worked, what needs attention, and what might be worth testing next.
Platforms
A working stack for campaign operations, reporting, and dashboard-ready measurement.
CRM & Email
Salesforce email and dashboard certifications, HubSpot campaign experience, list hygiene, segmentation thinking, and campaign operations workflows.
Analytics
GA4 reporting, campaign source and medium structure, UTM naming, landing-page behavior, event tracking, and small-sample interpretation.
Reporting
Dashboard-ready summaries, Google Sheets cleanup, CSV import/export workflows, Mailchimp reporting, and clear readouts for non-technical teams.
Applied Learning
My measurement work combines certifications, self-directed builds, and volunteer-ready projects. I focus on practical reporting that helps teams understand campaign activity without making the work feel more complicated than it needs to be.
I am using public community gallery projects, starting with softball galleries, as practical spaces to build GA4 reporting habits, compare audience behavior, and test how shared links, social posts, and gallery structure affect engagement.
Ongoing Case Study
A sensitive national communication spanning seven U.S. regions and their member leagues, reframed as a clear recipient experience and carried through production, delivery, measurement, and remediation.
Role: Campaign strategy, UX and content hierarchy, HTML email production, Mailchimp implementation, contact-list hygiene, stakeholder coordination, and performance analysis.
An important request for In Memoriam submissions received limited response when it appeared among unrelated items in a general, bullet-based email. The emotionally sensitive ask needed clearer purpose, prominence, and direction.
I reframed the request as a dedicated campaign organized around three recipient questions: What is being requested? Why does it matter? What should I do next? The intentionally simple HTML email used clear hierarchy, readable content, and a direct response path, then moved into Mailchimp for repeatable delivery and measurement.
This was a binary request, not a conventional promotional funnel. A recipient could read the message, determine there was nothing to submit, and complete the intended decision without clicking. Opens indicate awareness and submissions indicate relevant action, but clicks against the full list are not a meaningful failure or conversion rate.
The Saturday-afternoon send reached 258 of 283 attempted recipients across seven U.S. regions and their member leagues. Mailchimp reported 141 unique opens, 11 unique clickers, 512 total opens, and 15 total clicks, with no unsubscribes or abuse reports. Privacy protections can inflate opens, so the 54.7% figure is presented as reported engagement rather than a benchmark claim.
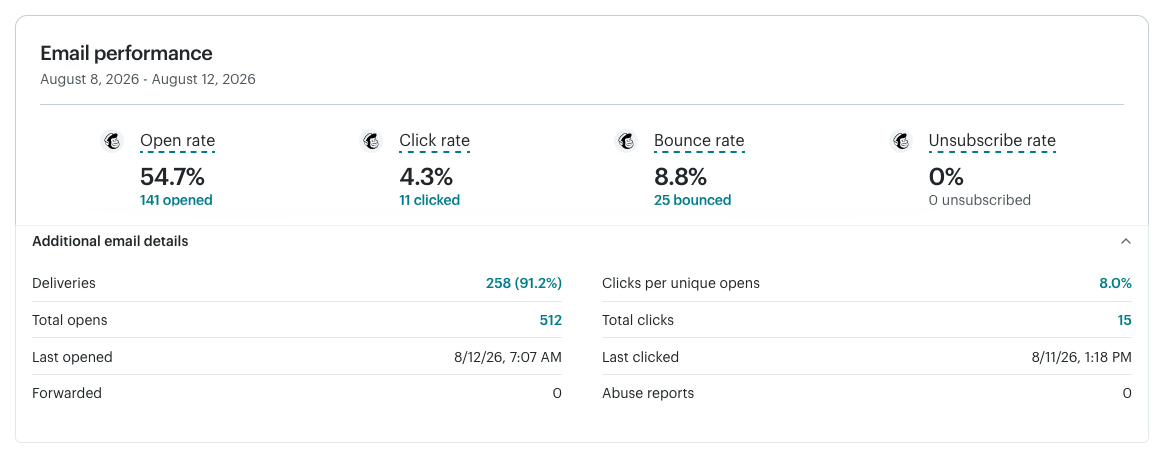
| Delivery signal | Count | Rate |
|---|---|---|
| Successful deliveries | 258 | 91.2% |
| Bounces | 25 | 8.8% |
| Unique opens | 141 | 54.7% |
| Unique clickers | 11 | 4.3% |
Seventeen of the 25 bounces were associated with one member organization and were primarily soft bounces connected to its email-forwarding system. Separating engagement from delivery exposed a concentrated infrastructure issue rather than treating every bounce as the same contact-data problem.
After confirmed removals, the next sendable list is expected to contain 273 recipients. Correcting only the revised address and regional typo would produce an equivalent projected bounce rate of about 4.8%. If all eight retained forwarding addresses deliver, the potential rate is about 2.2%. These are scenarios, not measured results.
The next send will validate actual deliverability improvement and add submission outcomes. A future version could provide two explicit paths: submit a notification or confirm there is nothing to submit. That would make confirmed-response coverage measurable without misclassifying silence as failure.
Reporting window: August 8–12, 2026. Results are based on sanitized Mailchimp reporting and campaign records. Contact details and individual recipient behavior are excluded. Final submission outcomes and next-send deliverability remain in progress.
Case Study
A practical measurement example using public gallery projects, GA4 event tracking, and campaign reporting.
Which gallery shares are leading people to do more than visit a page?
I added GA4 event tracking for gallery image downloads. Each event passed the selected image name into GA4, which made it possible to see which images people saved and which campaign links led to those actions.
| Session campaign | Downloads | Share |
|---|---|---|
| heatstrokes_gallery_2026 | 46 | 43.4% |
| sfgsl_week4 | 15 | 14.2% |
| psgsl_gallery | 14 | 13.2% |
| sfgsl_gallery | 8 | 7.5% |
| millie_nmx | 6 | 5.7% |
This turns a simple photo gallery into a measurable publishing system. Instead of stopping at page visits, the reporting shows which images people valued enough to save and which campaigns created deeper engagement.
Based on sanitized GA4 exploration views for gallery image download activity. The numbers are presented as an early measurement signal and setup example, not a broad performance claim.
Signals
This page shows the bridge between creative operations, campaign execution, and measurement. The examples use sanitized reporting from public gallery pages and volunteer-ready campaign workflows, including traffic sources, landing pages, engagement, device mix, referral patterns, and email click activity.